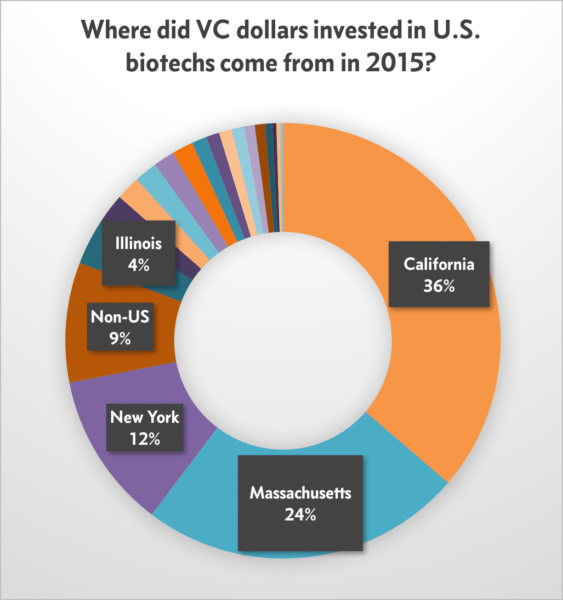
2015 proved to be the biggest year on record for venture investing in U.S. biotechs. A total of $7.7 billion flowed into a range of startups, some clustered in Boston/Cambridge and San Francisco, but with quite a large amount finding its way to drug developers off the beaten biotech path.
This year the money has continued to flow at the same torrid pace, even though the IPO window for drug developers has dropped down to an uncomfortable squeeze space for the hottest, or most desperate, companies to aim at.
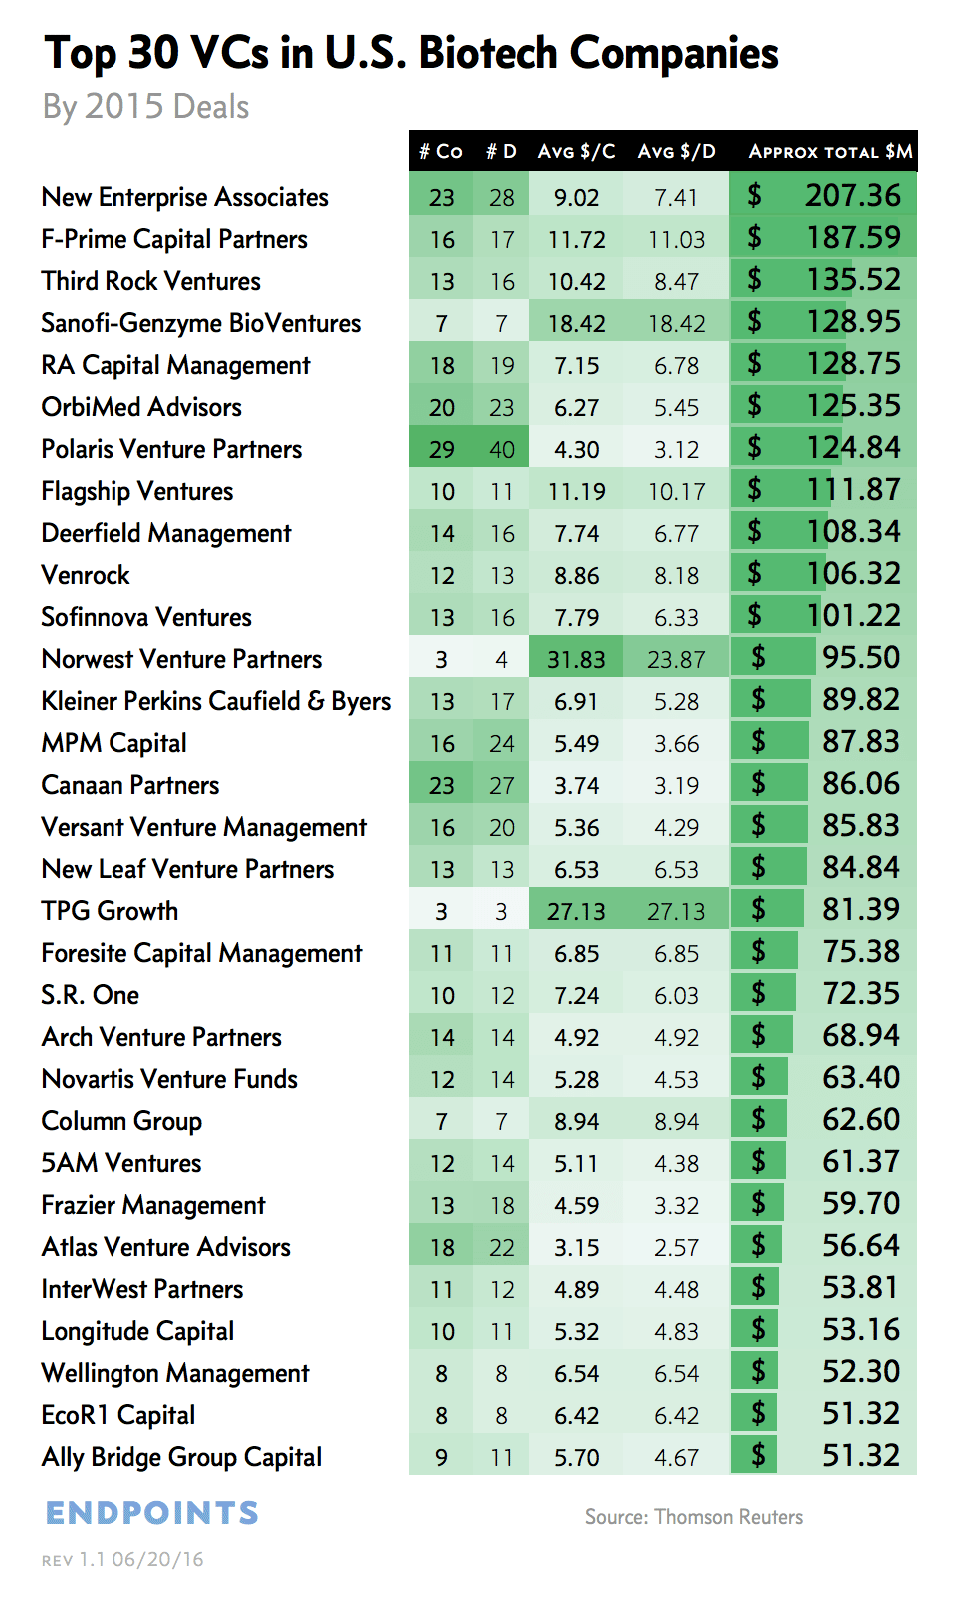
But how do the VCs rank in terms of deals and dollars? I asked Thomson Reuters, which does the numbers for the MoneyTree Report from PricewaterhouseCoopers LLP and the National Venture Capital Association, and they came back with the list below. (No, wait for it.)
Thomson Reuters’ analyst gleans information for these numbers out of press releases, SEC filings, and wherever else they can be found. Deal numbers are fairly easy to track, as the VCs and companies enjoy putting out the numbers on their progress. Specific dollar amounts invested, which typically aren’t announced, are much harder to follow.
To come up with a dollar amount for the total invested by each VC, they took the total round reported and, in the absence of hard numbers, broke it down by averages. If 5 VCs bet $50 million on a company, that would count for $10 million each – even if the hard numbers don’t stack up that way. If there’s only one VC doing the round, that’s easier to keep track of.

David Mott, NEA
What you get is an approximation of the total, which is why New Enterprise Associates—a VC group with a $3 billion global megafund that likes to go in big—ranks at the top of the list. If you base the list on the number of deals alone, a busy Polaris comes out on top.Many of the most prominent VCs do much, much more than just offer money. Third Rock has launched a wave of new companies on both coasts, always dispatching a partner to play interim helmsman. David Mott at NEA didn’t just back Mersana and its ADC tech, he grabbed the chairman’s spot on the board and has a hands-on role in management with CEO Anna Protopapas. When Amy Schulman left Pfizer’s consumer healthcare division and later took up residence at Polaris, she swiftly settled into playing a key role at 7 companies: CEO of Arsia, co-founder Lyndra and a board member of 5 more companies.

Amy Schulman, Polaris
There’s also an interesting angle to watch in terms of the geography of money. Four of the top 5 VCs on this list are based in Boston/Cambridge. But California is home for 9 of the top 20. Throw in a couple from New York, close to the markets, and GSK’s S.R. One, with offices in Cambridge, MA and San Francisco as well as the pharma giant’s U.S. base in Pennsylvania, and you can see how the money at the top VCs stays close to the companies they invest in — or vice versa.
 That’s an important distinction, as many of these venture investors don’t like to travel far for a board meeting. If a partner has 7 companies to watch, they’re likely not going to want to go globetrotting constantly. And that’s one reason why London and New York continue to be shortchanged on startup cash.
Fix that, and you’ll fix your hub development issues in up-and-coming territories. But trends are difficult things to fight, which is why San Francisco and Boston/Cambridge will continue to attract the lion’s share of the cash for some time to come.
I expect I’ll get quite a few calls on this one. And I’ll be happy to update the numbers if firms want to open up.
(You’re good to go.) — John Carroll
Top 100 VC firms investing in U.S. biotech companies
Based on 2015 deals
| Firm | # Cos | # Deals | Avg Deal | Avg Co. | Approx $(M) | State | |
|---|---|---|---|---|---|---|---|
| 1 | New Enterprise Associates, Inc. | 23 | 28 | 7.41 | 9.02 | 207.36 | California |
| 2 | F-Prime Capital Partners | 16 | 17 | 11.03 | 11.72 | 187.59 | Massachusetts |
| 3 | Third Rock Ventures LLC | 13 | 16 | 8.47 | 10.42 | 135.52 | Massachusetts |
| 4 | Sanofi-Genzyme BioVentures | 7 | 7 | 18.42 | 18.42 | 128.95 | Massachusetts |
| 5 | RA Capital Management LLC | 18 | 19 | 6.78 | 7.15 | 128.75 | Massachusetts |
| 6 | OrbiMed Advisors LLC | 20 | 23 | 5.45 | 6.27 | 125.35 | New York |
| 7 | Polaris Partners | 29 | 40 | 3.12 | 4.30 | 124.84 | Massachusetts |
| 8 | Flagship Ventures | 10 | 11 | 10.17 | 11.19 | 111.87 | Massachusetts |
| 9 | Deerfield Management Company LP | 14 | 16 | 6.77 | 7.74 | 108.34 | New York |
| 10 | Venrock Inc | 12 | 13 | 8.18 | 8.86 | 106.32 | California |
| 11 | Sofinnova Ventures Inc | 13 | 16 | 6.33 | 7.79 | 101.22 | California |
| 12 | Norwest Venture Partners | 3 | 4 | 23.87 | 31.83 | 95.50 | California |
| 13 | Kleiner Perkins Caufield & Byers LLC | 13 | 17 | 5.28 | 6.91 | 89.82 | California |
| 14 | MPM Capital LLC | 16 | 24 | 3.66 | 5.49 | 87.83 | Massachusetts |
| 15 | Canaan Partners | 23 | 27 | 3.19 | 3.74 | 86.06 | California |
| 16 | Versant Venture Management, LLC | 16 | 20 | 4.29 | 5.36 | 85.83 | California |
| 17 | New Leaf Venture Partners LLC | 13 | 13 | 6.53 | 6.53 | 84.84 | New York |
| 18 | Tpg Growth LLC | 3 | 3 | 27.13 | 27.13 | 81.39 | California |
| 19 | Foresite Capital Management LLC | 11 | 11 | 6.85 | 6.85 | 75.38 | California |
| 20 | S.R. One, Limited | 10 | 12 | 6.03 | 7.24 | 72.35 | Pennsylvania |
| 21 | Arch Venture Partners LLC | 14 | 14 | 4.92 | 4.92 | 68.94 | Illinois |
| 22 | Novartis Venture Funds | 12 | 14 | 4.53 | 5.28 | 63.40 | Non-US |
| 23 | Column Group | 7 | 7 | 8.94 | 8.94 | 62.60 | California |
| 24 | 5AM Ventures LLC | 12 | 14 | 4.38 | 5.11 | 61.37 | California |
| 25 | Frazier Management LLC | 13 | 18 | 3.32 | 4.59 | 59.70 | Washington |
| 26 | Atlas Venture Advisors Inc | 18 | 22 | 2.57 | 3.15 | 56.64 | Massachusetts |
| 27 | InterWest Partners LLC | 11 | 12 | 4.48 | 4.89 | 53.81 | California |
| 28 | Longitude Capital Management Co LLC | 10 | 11 | 4.83 | 5.32 | 53.16 | California |
| 29 | Wellington Management Company LLP | 8 | 8 | 6.54 | 6.54 | 52.30 | Massachusetts |
| 30 | EcoR1 Capital LLC | 8 | 8 | 6.42 | 6.42 | 51.32 | California |
| 31 | Ally Bridge Group Capital Partners II LP | 9 | 11 | 4.67 | 5.70 | 51.32 | Non-US |
| 32 | Arboretum Ventures | 6 | 8 | 5.40 | 7.21 | 43.23 | Michigan |
| 33 | Domain Associates LLC | 12 | 14 | 2.96 | 3.46 | 41.50 | New Jersey |
| 34 | Sandbox Industries LLC | 4 | 5 | 8.23 | 10.29 | 41.15 | Illinois |
| 35 | Novo A/S | 17 | 19 | 2.07 | 2.31 | 39.35 | Non-US |
| 36 | Hatteras Venture Partners | 10 | 12 | 3.21 | 3.85 | 38.53 | North Carolina |
| 37 | ProQuest Investments | 2 | 2 | 19.03 | 19.03 | 38.06 | Florida |
| 38 | F Hoffmann La Roche AG | 6 | 7 | 5.30 | 6.18 | 37.07 | Non-US |
| 39 | CHL Medical Partners LP | 3 | 3 | 12.29 | 12.29 | 36.86 | Connecticut |
| 40 | Khosla Ventures LLC | 5 | 5 | 7.34 | 7.34 | 36.72 | California |
| 41 | Rock Springs Capital Management LP | 8 | 8 | 4.59 | 4.59 | 36.69 | Maryland |
| 42 | Venture Investors LLC | 12 | 14 | 2.56 | 2.98 | 35.80 | Wisconsin |
| 43 | Lumira Capital Corp. | 7 | 7 | 5.04 | 5.04 | 35.25 | Non-US |
| 44 | Chicago Pacific Founders Fund LP | 1 | 1 | 35.00 | 35.00 | 35.00 | Illinois |
| 45 | HIG Capital LLC | 4 | 4 | 8.70 | 8.70 | 34.79 | Florida |
| 46 | Sequoia Capital | 4 | 4 | 8.59 | 8.59 | 34.38 | California |
| 47 | Aisling Capital LLC | 4 | 4 | 8.40 | 8.40 | 33.60 | New York |
| 48 | Vatera Healthcare Partners LLC | 1 | 1 | 33.50 | 33.50 | 33.50 | New York |
| 49 | Hope Investments Management Co Ltd | 1 | 1 | 33.33 | 33.33 | 33.33 | Non-US |
| 50 | Warburg Pincus LLC | 2 | 4 | 8.33 | 16.66 | 33.32 | New York |
| 51 | Alexandria Real Estate Equities, LLC | 3 | 3 | 11.00 | 11.00 | 33.01 | California |
| 52 | Windham Venture Partners | 5 | 5 | 6.32 | 6.32 | 31.58 | New York |
| 53 | Lightstone Ventures LP | 7 | 7 | 4.39 | 4.39 | 30.76 | California |
| 54 | Takeda Ventures Inc | 2 | 2 | 15.23 | 15.23 | 30.45 | California |
| 55 | Sailing Capital Management Co Ltd | 2 | 2 | 15.14 | 15.14 | 30.27 | Non-US |
| 56 | Sanderling Ventures | 6 | 7 | 4.31 | 5.02 | 30.15 | California |
| 57 | Oak Investment Partners | 2 | 2 | 15.00 | 15.00 | 30.00 | Connecticut |
| 58 | Mohr Davidow Ventures | 4 | 5 | 5.94 | 7.42 | 29.70 | California |
| 59 | Mission Bay Capital LLC | 6 | 8 | 3.70 | 4.93 | 29.61 | California |
| 60 | HBM Healthcare Investments AG | 5 | 5 | 5.63 | 5.63 | 28.17 | Non-US |
| 61 | Tiger Management Corp | 2 | 2 | 13.90 | 13.90 | 27.79 | New York |
| 62 | Venbio Partners LLC | 5 | 5 | 5.44 | 5.44 | 27.19 | California |
| 63 | Morgenthaler Ventures | 10 | 14 | 1.94 | 2.72 | 27.17 | California |
| 64 | Edmond de Rothschild Investment Partners SAS | 4 | 5 | 5.38 | 6.73 | 26.91 | Non-US |
| 65 | Pfizer Venture Investments | 6 | 6 | 4.41 | 4.41 | 26.44 | New York |
| 66 | Sutter Hill Ventures | 2 | 2 | 13.19 | 13.19 | 26.38 | California |
| 67 | Puretech Ventures | 2 | 3 | 8.67 | 13.01 | 26.02 | Massachusetts |
| 68 | Omega Fund Management LLC | 5 | 5 | 5.15 | 5.15 | 25.73 | Massachusetts |
| 69 | Morningside Technologies | 4 | 4 | 6.39 | 6.39 | 25.54 | Non-US |
| 70 | Sectoral Asset Management Inc | 4 | 4 | 6.33 | 6.33 | 25.31 | Non-US |
| 71 | Avalon Ventures, LLC | 6 | 6 | 4.21 | 4.21 | 25.25 | California |
| 72 | Bezos Expeditions | 1 | 1 | 25.00 | 25.00 | 25.00 | Washington |
| 73 | Osage Partners | 7 | 7 | 3.54 | 3.54 | 24.81 | Pennsylvania |
| 74 | Partners Innovation Fund LLC | 6 | 6 | 4.09 | 4.09 | 24.55 | Massachusetts |
| 75 | Aperture Venture Partners LLC | 7 | 7 | 3.49 | 3.49 | 24.41 | New York |
| 76 | Keiretsu Forum | 20 | 23 | 1.05 | 1.21 | 24.19 | California |
| 77 | Sante Ventures | 7 | 7 | 3.32 | 3.32 | 23.23 | Texas |
| 78 | Pappas Ventures | 6 | 6 | 3.81 | 3.81 | 22.83 | North Carolina |
| 79 | Advanced Technology Ventures | 4 | 6 | 3.57 | 5.36 | 21.44 | California |
| 80 | Abingworth Management Ltd | 5 | 6 | 3.57 | 4.28 | 21.41 | Non-US |
| 81 | Baxter Ventures | 5 | 5 | 3.99 | 3.99 | 19.96 | Illinois |
| 82 | RiverVest Venture Partners LLC | 6 | 7 | 2.74 | 3.20 | 19.21 | Missouri |
| 83 | Tekla Healthcare Investors | 4 | 5 | 3.83 | 4.78 | 19.13 | Massachusetts |
| 84 | Correlation Ventures LP | 8 | 8 | 2.35 | 2.35 | 18.81 | California |
| 85 | Google Ventures | 6 | 6 | 3.10 | 3.10 | 18.57 | California |
| 86 | Remeditex Ventures LLC | 4 | 5 | 3.30 | 4.12 | 16.49 | Texas |
| 87 | HealthQuest Capital | 4 | 6 | 2.63 | 3.94 | 15.78 | California |
| 88 | Mountain Group Capital LLC | 7 | 8 | 1.93 | 2.20 | 15.43 | Tennessee |
| 89 | Advantage Capital Partners | 4 | 7 | 2.06 | 3.61 | 14.45 | Louisiana |
| 90 | U.S. Venture Partners | 5 | 8 | 1.81 | 2.89 | 14.44 | California |
| 91 | Lilly Ventures | 3 | 5 | 2.87 | 4.78 | 14.34 | Indiana |
| 92 | Radius Ventures LLC | 2 | 5 | 2.79 | 6.98 | 13.95 | New York |
| 93 | Intersouth Partners | 5 | 6 | 2.24 | 2.68 | 13.41 | North Carolina |
| 94 | Ascension Ventures | 4 | 5 | 2.32 | 2.91 | 11.62 | Missouri |
| 95 | Johnson & Johnson Innovation-JJDC Inc | 5 | 6 | 1.84 | 2.21 | 11.04 | New Jersey |
| 96 | Prolog Ventures | 5 | 5 | 2.08 | 2.08 | 10.39 | Missouri |
| 97 | InCube Ventures LLC | 3 | 5 | 1.99 | 3.31 | 9.94 | California |
| 98 | Partisan Management Group, Inc. | 5 | 6 | 1.45 | 1.74 | 8.71 | Colorado |
| 99 | Healthcare Ventures, LLC | 5 | 5 | 1.57 | 1.57 | 7.84 | Massachusetts |
| 100 | Tullis Health Investors | 4 | 7 | 1.01 | 1.76 | 7.05 | Connecticut |
| 101 | MB Venture Partners LLC | 11 | 14 | 0.44 | 0.56 | 6.21 | Tennessee |
| 102 | Connecticut Innovations Inc | 10 | 14 | 0.39 | 0.55 | 5.47 | Connecticut |
| 103 | Mercury Partners Management LLC | 6 | 7 | 0.75 | 0.87 | 5.23 | Texas |
| 104 | BioGenerator | 10 | 11 | 0.46 | 0.50 | 5.01 | Missouri |
| 105 | Sv Life Sciences Advisers Llp | 6 | 6 | 0.76 | 0.76 | 4.54 | Massachusetts |
| 106 | Tech Coast Angels | 4 | 5 | 0.69 | 0.86 | 3.44 | California |
| 107 | Innova Memphis Inc | 11 | 13 | 0.19 | 0.23 | 2.49 | Tennessee |
| 108 | Ben Franklin Technology Partners Southeastern PA | 9 | 9 | 0.17 | 0.17 | 1.53 | Pennsylvania |
| 109 | Innovation Works Inc | 6 | 6 | 0.04 | 0.04 | 0.26 | Pennsylvania |


